Understanding Candlestick Patterns and What They Tell You
Learn to read the basic candle formations that repeat across all markets. We'll cover hammers, engulfing patterns, and dojis with real examples.

Why Candlesticks Matter in Trading
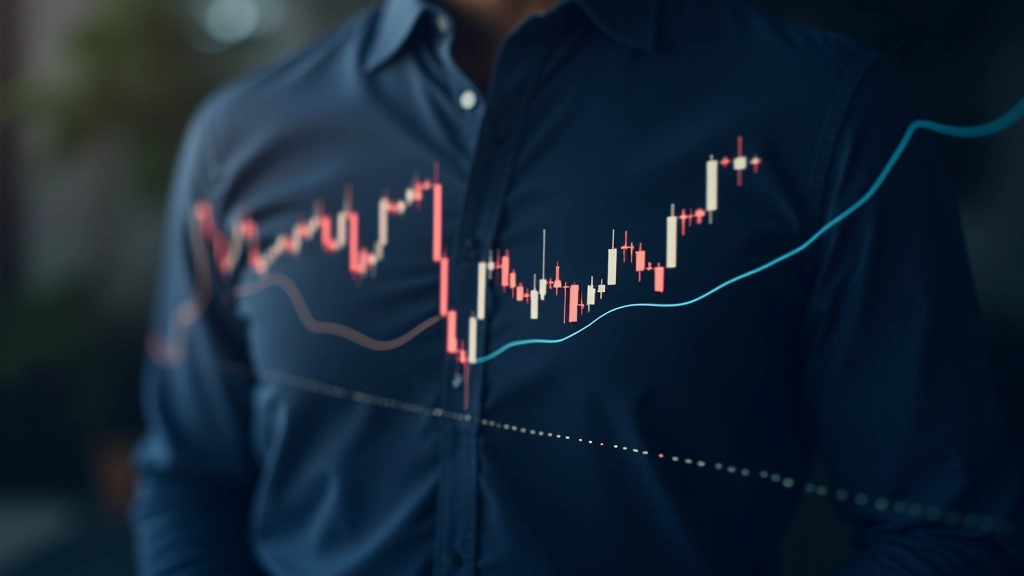
You've probably seen candlestick charts before — those red and green bars on every trading platform. They're not just pretty colors. Each candle tells you a complete story about what happened in the market during a specific time period. The price opened, moved around, and closed. That's the whole picture in one bar.
Here's the thing: candlesticks have been around for centuries. Japanese rice traders used them before anyone in the West even thought about technical analysis. They work because they show you real human behavior — fear, greed, indecision. When you learn to read them, you're not just looking at numbers. You're seeing what actual traders are doing.
What You'll Learn
- How to read a single candle
- The 5 most reliable patterns
- When to trust them and when to ignore them
- How to spot reversals before they happen
The Anatomy of a Candlestick
Every candlestick has four main components. The body is the thick part — it shows you where the price opened and closed. If it's green, the close was higher than the open. If it's red, the close was lower. Simple.
Then you've got the wicks (or shadows). These are the thin lines sticking out from the top and bottom. They show the highest and lowest prices reached during that time period, even if they didn't hold. A long upper wick? That means buyers pushed the price up, but sellers fought back and brought it down. That's friction. That's indecision.
What matters most isn't just what happened — it's the relationship between these parts. A candle with a tiny body and massive wicks is telling you something completely different from a candle with a huge body and no wicks. We'll get to specific patterns in a moment, but first you need to understand that you're reading a battle between buyers and sellers.

Educational Information
This guide is for educational purposes. We're teaching you how to read charts and understand market patterns. We're not telling you to buy or sell anything. Real trading involves risk — always understand what you're doing and consult with a qualified financial advisor if you're managing real money. Candlestick patterns are tools, not crystal balls.
The Hammer Pattern
A hammer looks exactly like its name — a small body at the top with a long lower wick. It shows up at the bottom of a downtrend and it's saying something important: sellers tried to push the price down, but buyers stepped in and fought back. The fact that the candle closed near the high means buyers won that battle.
You'll see hammers after a sharp selloff. Prices dropped hard, then reversed. That's what traders call a potential reversal pattern. But here's where most beginners go wrong — they see a hammer and immediately buy. Don't. A hammer is more reliable when there's something beneath it. Support levels matter. A hammer at a major support zone? That's worth paying attention to. A hammer in the middle of nowhere? Could be a trap.
Real example: During a market decline, price drops 8% in two days, then on day three you see a hammer form. That's a signal that the downtrend might be pausing. Not guaranteed — markets don't guarantee anything. But it's a probability shift.
Engulfing Patterns — The Reversal Signal
An engulfing pattern is when a candle completely covers the previous candle's body. A bullish engulfing happens in a downtrend — you'll see a small red candle followed by a larger green candle that engulfs it. That's momentum shifting. Sellers had control, but buyers took over and pushed past where the previous day opened.
What makes this pattern work? It's about effort and success. The second candle shows that buying pressure is strong enough not just to reverse the previous loss, but to exceed it. You're seeing a clear change in control. We're talking about two consecutive candles, which makes this pattern much more reliable than looking at a single bar.
The bearish version works the same way but in reverse — a small green candle followed by a larger red candle that completely covers it. This typically shows up near tops and signals that selling pressure is increasing. In a 5-day rally, if you see a bearish engulfing, it's worth asking if the trend is about to pause.

The Doji — Indecision Signal
A doji is a candle where the open and close are at basically the same price. It's a cross or a plus sign shape. What's it telling you? Neither buyers nor sellers could win. The price moved around during the period, but ended where it started. That's uncertainty.
Don't overuse dojis. You'll see them all the time in choppy markets where nothing's happening. But when you see a doji after a strong trend, that's interesting. It might mean momentum is fading. After a big rally, a doji appears, and then the next day the market drops? That sequence is telling you something shifted. The buyers who were in control yesterday couldn't hold their gains.
Think of it as a pause button. It's not a reversal pattern on its own — it's more like a question mark. "Is the trend continuing or not?" You need context. A doji at a resistance level in a downtrend? More significant. A doji in the middle of a normal day? Could be noise.
Quick Pattern Reference
These five patterns show up repeatedly across all markets. Once you recognize them, you'll start seeing them everywhere.
Hammer
Small body at top, long lower wick. Appears at bottoms. Signals potential reversal when support is nearby.
Hanging Man
Looks like a hammer but appears at tops. Shows weakness after a rally. Sellers testing the market.
Engulfing
Two-candle pattern where the second completely covers the first. Clear shift in momentum and control.
Doji
Open equals close. Signals indecision. Most reliable after a strong move or at resistance/support.
Morning Star
Three candles: down, gap down, then up. Classic reversal pattern. Takes time to confirm but strong signal.
Making Patterns Work for You
Context is Everything
The same pattern means different things in different situations. A hammer at a major support level? Strong signal. A hammer in the middle of a sideways market? Probably nothing. You've got to zoom out and see the bigger picture. Are we in an uptrend, downtrend, or range? That context changes how you interpret the pattern.
Confirmation Matters
Don't act on a single candle or pattern. Wait for confirmation. If a hammer shows up and the next candle is green and closes higher, that's confirmation. The market is agreeing with what the hammer suggested. Patience here beats jumping in early.
Volume Adds Weight
A pattern with high volume behind it is stronger than the same pattern on light volume. When you see an engulfing pattern and volume spikes, buyers are really stepping in. When volume is low, it might just be a few traders moving the price around.

Start Recognizing Patterns Today
Candlestick patterns aren't complicated once you understand what they're showing you. They're simply a visual representation of what buyers and sellers are doing. The body shows control, the wicks show struggle. The combination tells you whether momentum is shifting or holding.
You don't need to memorize 50 patterns. Focus on these five — hammers, engulfing, dojis, hanging men, and morning stars. See them on your charts. Understand why they're there. Then practice spotting them in real market conditions. That's how you build genuine skill that lasts.
The markets have been using these same signals for hundreds of years. They work because they reflect human behavior, and human behavior doesn't change. Fear and greed repeat endlessly. Candlestick patterns are just a way of seeing that repetition before it plays out.